

The first set of occupations is the Business and Financial Operations Occupations (Census Codes 0500-0950 and SOC Codes 13-0000) and the second set of occupations is the Computer, Engineering, and Science Occupations (Census Codes 1000-1965 and SOC Codes 15-0000-19-0000). The latter set of occupations consists of three subcategories of occupations: Computer and Mathematical Occupations (Census Codes 1000-1240 and SOC Code 15-0000); Architecture and Engineering Occupations (Census Codes 1300-1560 and SOC code 17-0000; and Life, Physical, and Social Science Occupations (Census Codes 1600-1965 and SOC Code 19-0000).
Business and Financial Operations Occupations
(Census Codes 0500-0950 and SOC Codes 13-0000)
In the Business and Financial Operations Occupations category there have been some changes in the census codes and SOC codes. For example, the Compliance Officers occupation (0565/13-1041)2 no longer includes transportation security screeners. In addition, the "Human resources, training, and labor relations specialists" occupation in 2010 EEO Tabulation has been split into three occupation titles of Human Resources Workers (0630/13-1070), Compensation, Benefits, and Job Analysis Specialists (0640/13-1141), and Training and Development Specialists (0650/13-1151). Finally, 2010 EEO Tabulation adds three new occupations: Fundraisers (0726/13-1131),3 Market Research Analysts and Marketing Specialists (0735/13-1161), and Business Operations Specialists, All Other (0740/13-1199).4
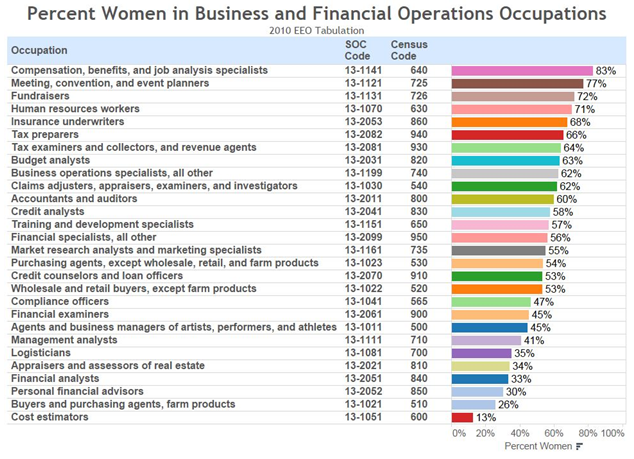
The chart below shows the percent women in Business and Financial Operation Occupations. More than half of the jobs in this category can be considered female dominated occupations. For example, women occupy more than 70% of Human Resources Workers, Fundraisers, Meeting Planners, and also Compensation and Benefit Analysts occupations. Similarly, 60% or more, of Accountant, Tax Analyst, and Insurance Underwriter positions are held by women. On the other hand, women occupy only 13% of Estimators and 26% of Buyers and Purchasing Agent positions.
|
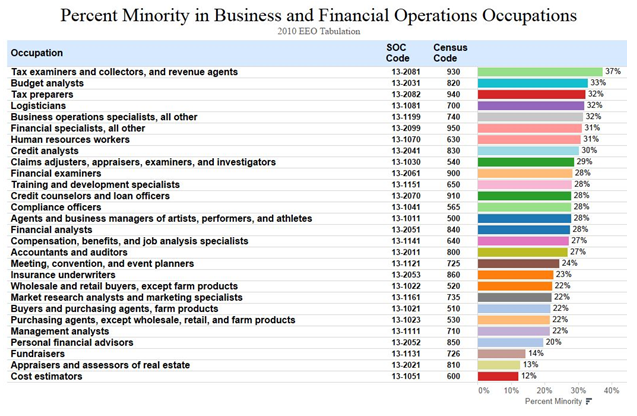
The 2010 EEO Tabulation percent minority for the Business and Financial Operations Occupations is shown in the next chart. While minorities hold more than 30% of the Tax Examiners, Budget Analysts, Tax Preparers, and Logisticians, their representation in the Cost Estimators, Appraisers, and Fundraisers is less than 20%.
A comparison of availabilities or percent minority in the Business and Financial Operations Occupations in the 2000 EEO Tabulation and the 2010 EEO Tabulation reveals that minorities have experienced positive changes in their shares across all occupations within the category. These positive changes range from an 8.76% increase in the percent of minorities in the Financial Analysts occupation to a 2.68% increase in percent minorities in the Cost Estimators occupation.
|
(Census Codes 1000-1965 and SOC Codes 15-0000-19-0000)
In the 2010 EEO Tabulation the occupational titles, census codes, and SOC codes for Computer, Engineering, and Science Occupations have changed for some of the categories. For example, in the 2000 EEO Tabulation the Computer Scientists and Systems Analysts (1000/15-10XX) category was split into three occupation categories: Computer and Information Research Scientists (1005/15-1111), Computer Systems Analysts (1006/15-1121), and Computer Occupations, All Other (1107/15-1199) in 2010 EEO Tabulation. Also, Network Systems and Data Communications Analysts (1110/15-1081) was also split into three occupations: Information Security Analysts (1007/15-1122), Web Developers (1030/15-1134), and Computer Network Architects (1106/15-1143). In addition, Other Life, Physical, and Social Science Technicians (1960/19-40XX) was split into two occupations: Social Science Research Assistants (1950/19-4061) and Miscellaneous Life, Physical, and Social Science Technicians (1965/19-4090). In the 2000 EEO Tabulation, the Market and Survey Researchers category (1810/19-3020) was split into two subcategories, the Market Research Analysts and Marketing Specialists category (0735/13-1161) which was moved into the Business and Financial Operations category and for the remaining Survey Researchers' the census code was changed to 1815 and the SOC code was changed to 19-3022. Finally, the Computer Software Engineers occupation (1020/15-1030) was split into "Software Developers, Applications, and Systems Software," "Software Developers, Applications," and "Software Developers, Systems Software." The SOC codes for these three new occupation titles are 15-113X, 15-1132, and 15-1133 respectively, but the census code for all three occupations remained the same as before, 1020.
In the next three sections I will show the representation of women and minorities in the three subcategories of the Computer, Engineering, and Science Occupations (Census Codes 1000-1965 and SOC Codes 15-0000-19-0000). These subcategories include: Computer and Mathematical Occupations (Census Codes 1000-1240 and SOC Code 15-0000); Architecture and Engineering Occupations (Census Codes 1300-1560 and SOC code 17-0000; Life, Physical, and Social Science Occupations (Census Codes 1600-1965 and SOC Code 19-0000).
- Computer and Mathematical Occupations
(Census Codes 1000-1240 and SOC Code 15-0000)
|
|
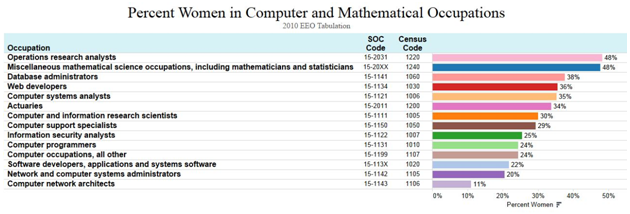
When we compare the representation of women in 2000 and 2010 in the individual computer science related occupations, we see a general pattern of decline. For example, in 2000, the representation of women was 41.5% in the Database Administrators occupation, but in 2010 their representation in that occupation dropped to 37.6%, a 3.9% decrease. Similarly, in 2000 the representation of women was 27.5% in the Computer Programmers occupation but in 2010 their representation in that occupation dropped to 24.4%, a 3.1% decrease. The comparison reveals that women were able to improve their representation in only one occupation within this occupational category, the Operations Research Analysts occupation, in which they were able to increase their representation from 46% to 48%, a 2% increase.
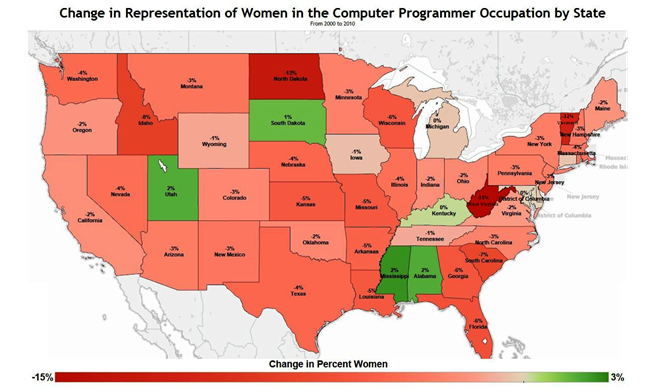
When this change in representation of women in the Computer Science related occupations are reviewed in various states, the decline appears to be more severe in some states than others. The chart below shows the state by state change in the representation of the women in the Computer Programmer occupation (SOC Code 15-1131 and Census Code 1010). The red shading indicates a decrease in the representation of women from 2000 to 2010 while the green shading indicates an increase in the representation of women.
As the chart below demonstrates, between 2000 and 2010, women in the state of Mississippi, Alabama, and Utah experienced an increase of 2% while in the state of South Dakota they experienced a 1% increase in their representation in the Computer Programmer occupation.7
In all other states, between 2000 and 2010, the representation of women in the Computer Programmer occupation decreased. For example, between 2000 and 2010 West Virginia had a 15% decrease, North Dakota had a 13% decrease, Vermont had a 12% decrease, Idaho had an 8% decrease, South Carolina had a 7% decrease, and Florida had a 6% decrease in the representation of women in the Computer Programmer occupation.
|
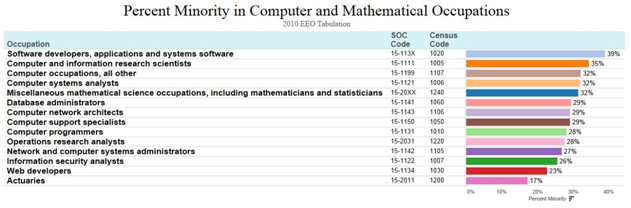
In contrast to women, between 2000 and 2010, the overall representation of minorities increased in the Computer and Mathematical occupations. These gains ranged from a 4% increase in the Computer Programmers occupations to about a 9% increase in the Computer Software Engineers occupations. Therefore, in contrast to women, between 2000 and 2010 minorities do not seem to experience the same pattern of decline in their representation within the computer related occupations.
- Architecture and Engineering Occupations
(Census Codes 1300-1560 and SOC code 17-0000)
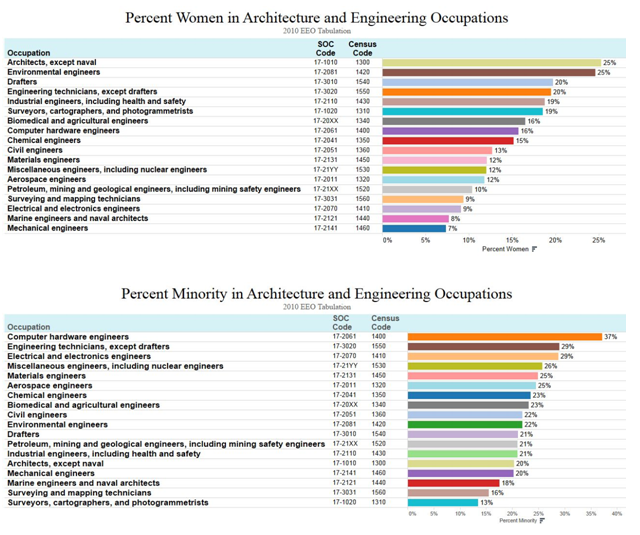
The representation of minorities in the Architecture and Engineering Occupations ranged from 37% in the Computer Hardware Engineers, 29% in the Engineering Technicians, except Drafters, and 29% in the Electrical and Electronics Engineers to 13% in the Surveyors, Cartographers, and Photogrammetrists, 16% in the Surveying and Mapping Technicians, and 18% in the Marine Engineers and Naval Architects.
When the 2010 EEO Tabulation is compared to the 2000 EEO Tabulation it appears that both women and minorities have generally experienced gains in their representation in the Architecture and Engineering Occupations. The highest gain for women was 5% in the Architects, except naval occupation and for minorities it was 6.85% in the Computer Hardware Engineers occupation.
|
- Life, Physical, and Social Science Occupations
(Census Codes 1600-1965 and SOC Code 19-0000)
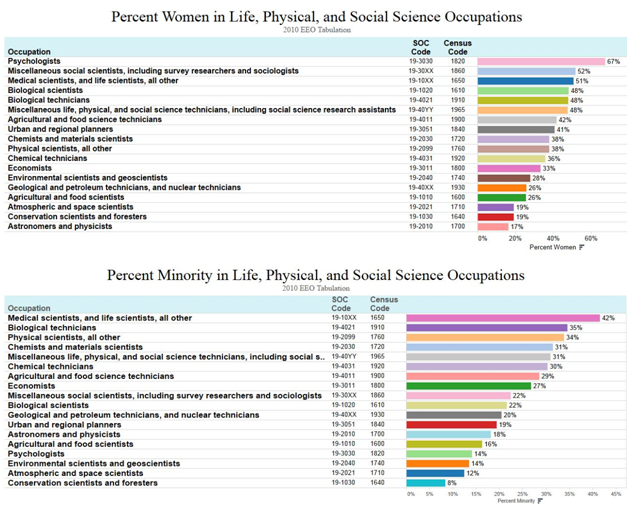
The representation of minorities in the Life, Physical, and Social Science Occupations ranged from 42% in the Medical Scientists and the Life Scientists, 35% in the Biological Technicians, and 34% in the Physical Scientists to 8% in the Conservation Scientists and Foresters, 12% in the Atmospheric and Space Scientists, and 14% in the Environmental Scientists and Geoscientists.
The comparison of the 2010 EEO Tabulation to the 2000 EEO Tabulation reveals that the representation of women in the Biological Technicians occupation decreased by 3.2%. The representation of women also decreased by less than 1% in Agricultural and Food Scientists as well as in the Agricultural and Food Science Technicians occupations. In the remaining occupations in the Life, Physical, and Social Science category, the representation of women increased. In both Urban and Regional Planners and Atmospheric and Space Scientists, the representation of women increased by more than 6%.
The comparison of the 2010 EEO Tabulation to the 2000 EEO Tabulation also reveals that the representation of minorities improved in all Life, Physical, and Social Science Occupations except in the Geological and Petroleum Technicians, and Nuclear Technicians occupation which experienced a decline of about 1.2%.
|
1. See: OFCCP's Notice for Contractors on the 2006-2010 Census Tab here: http://www.dol.gov/ofccp/.] ↵
2. For compliance officers' occupation the census code is 0565 and the SOC code is 13-1041. ↵
3. Fundraisers occupation has been separated from the Meeting and Convention Planners occupation. ↵
4. The occupational category of "Other Business Operations Specialists" in the 2000 EEO Tabulation has been split into two occupation categories of Market Research Analysts and Marketing Specialists (0735/13-1161) and Business Operations Specialists, All Other (0740/13-1199) in 2010 EEO Tabulation. ↵
5. In this post only gains and losses of 2% or more are considered. ↵
6. For example, see: http://chronicle.com/article/Rebooting-Recruiting-to-Get/135282/ ↵
7. Even though it is not shown in the chart, between 2000 and 2010, the representation of women in the state of Alaska also increased by 3%. ↵