

The 2010 EEO Tabulation provides the contractor community with the percentage of females and minorities, or availabilities, as well as other demographic information for occupational codes on more than 480 unique jobs. The contractors can use these external availability figures, in addition to their own internal availabilities, as benchmarks in their hiring and utilization analyses. The specific 2010 EEO tabulations, by detailed occupations, as well as the entire 2010 EEO Tabulation file are available through the United States Census Bureau website 2.
Below I will provide a very short peek at some of the characteristics of the new 2010 EEO tabulation and also very briefly compare it to 2000 EEO tabulation file. This comparison is important as the differences between the two files will be reflected in the availabilities and the benchmarks. The bigger the differences between the two files, the more different the new availabilities will be when compared to the current availabilities and benchmarks in use since 2005. As we continue our evaluation of the new 2010 EEO Tabulation, I will cover more related topics in my future posts.
The 2010 Equal Employment Opportunity (EEO) Tabulation is based on the American Community Survey (ACS). The ACS is a nationwide survey designed to provide demographics such as the characteristics of workforce by occupation, as well as other demographic data related to social, economic, and housing characteristics. The U.S. Census Bureau releases the data from the ACS in both single-year and multiyear estimates. The 2010 EEO Tabulation uses five years of statistics from the American Community Survey (2006-2010).
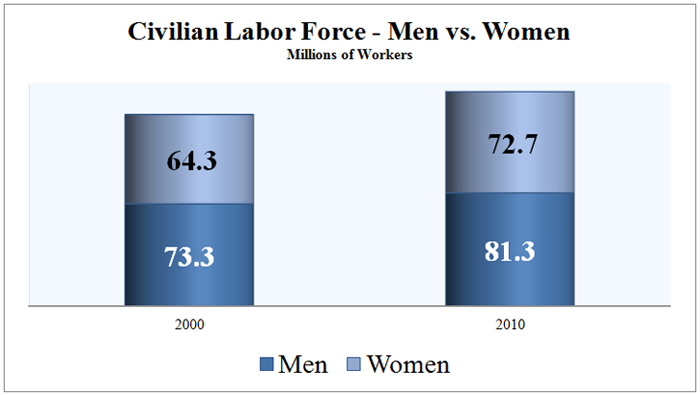
Starting with the overall U.S. civilian workforce (or the employed and unemployed workers who are 16 years or older and are not in the Armed Forces), in the 2000 EEO Tabulation, there were about 137.6 million workers. Among these, 73.3 million or (53.3%) were men, and 64.3 million or (46.7%) were women. A review of the 2010 EEO Tabulation reveals that the U.S. civilian workforce has since increased to about 154 million workers. Among these, 81.3 million or (52.8%) are men, and 72.7 million or (47.2%) are women. This means women's share in the labor force has increased very slightly, from 46.7% in 2000 to 47.2% in 2010.
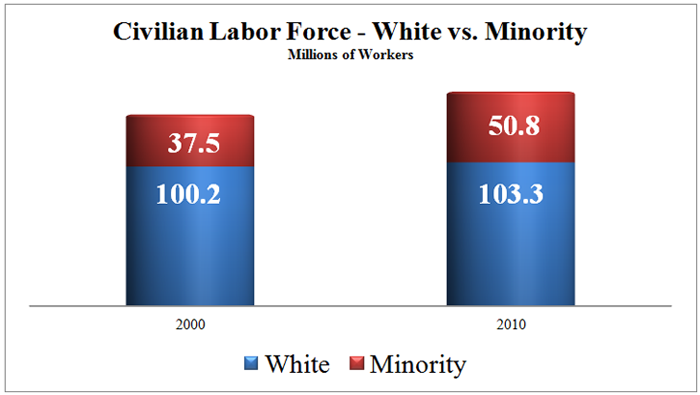
Similarly, in the 2000 EEO Tabulation, out of 137.7 million workers, 100.2 million or (72.8%) were White, and 37.5 million or (27.2%) were Minority. The 2010 EEO Tabulation reveals that out of 154.1 million workers, 103.3 million or (67.0%) are White, and 50.8 million or (30.0%) are Minority. This means the share of the minority workforce in the labor force in 2010 has increased, from 27.2% in 2000 to 30.0% in 2010.
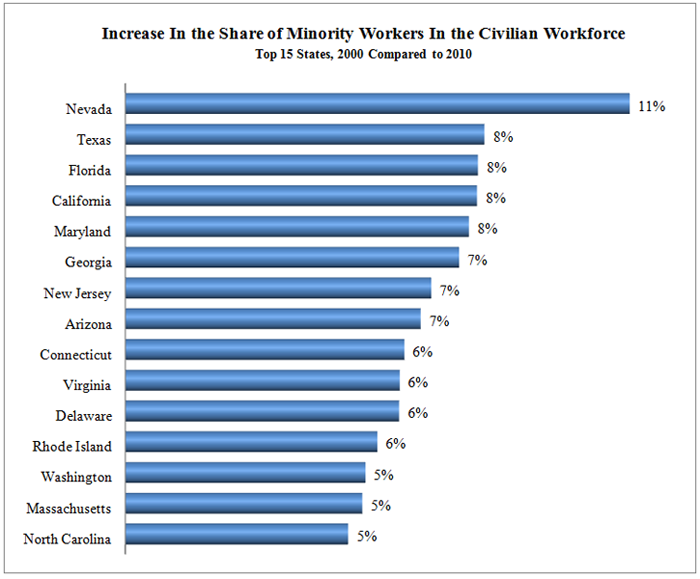
As expected, the distribution of the workforce by gender in different states and across all occupations has not changed substantially between 2000 and 2010. On the other hand, the distribution of the workforce by minority across all occupations has changed substantially in some states when the percent or share of the minority in the labor force in each state in 2000 is compared to the shares of minority in the same state in 2010. For example, in the 2000 EEO file, out of about 990,000 workers in the state of Nevada, 31% were minority. In the 2010 EEO file, there are about 1.3 million workers in Nevada, and of these, about 42% are minority workers. This means that Nevada had an 11.1% increase in the share of the minority workers in the labor force. Similarly, according to 2000 EEO file in the state of Texas, out of a labor force of about 10 million, 42% were minority. In the 2010 EEO file, there are about 12 million workers in the state of Texas, and about 50% of them are minority workers. This means that the state of Texas had an 8% increase in the share of the minority workers in the labor force. Finally, in the state of Florida, according to the 2000 EEO file, out of about 7 million workers, 33% were minority. In the 2010 EEO file, there are about 9 million workers in the state of Florida, and about 41% of them are minority workers. This means that the state of Florida has had an 8% increase in the share of the minority workers in the labor force. The increase in the share of minority workers in the labor force for the top 15 states with the highest increases in the minority shares are illustrated in the chart below.
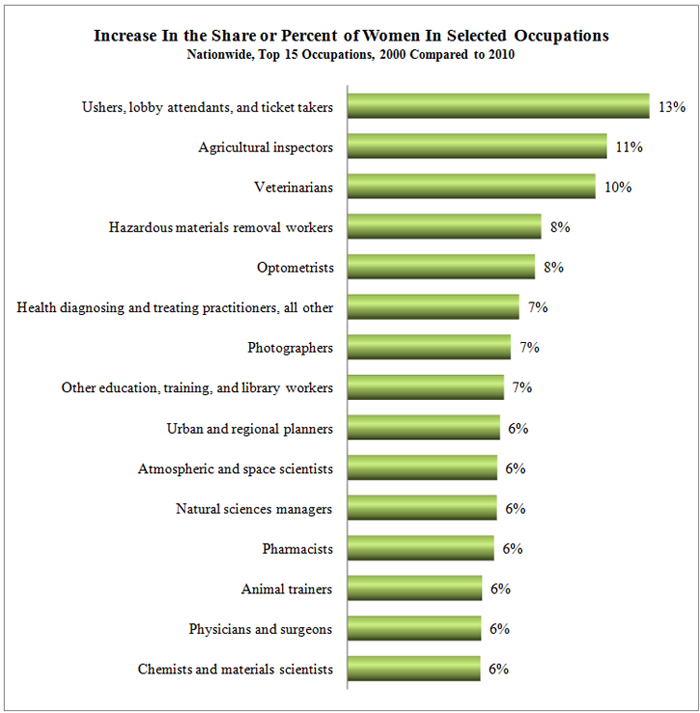
The 2010 and 2000 EEO file comparison also shows the gains that both women and minorities have enjoyed in their respective shares of the workforce in some occupations. For example, nationwide, the percent women in the "Ushers, lobby attendants, and ticket takers" occupation was 30.8% in 2000, but the 2010 EEO file shows that the percent women in this occupation has increased to 43.5%, or almost 13% . Similarly, the percent women in the "Agricultural inspectors" occupation was 31.5% in 2000, but the 2010 EEO file shows that percent women in this occupation has increased to 42.4%, or almost 11% . Finally, the percent women in the "Veterinarians" occupation was 39.5% in 2000, but the 2010 EEO file shows that percent women in this occupation has increased to 50.0%, or almost 11% . The chart below illustrates the top 15 occupations with the largest increase in the share or percent of women.
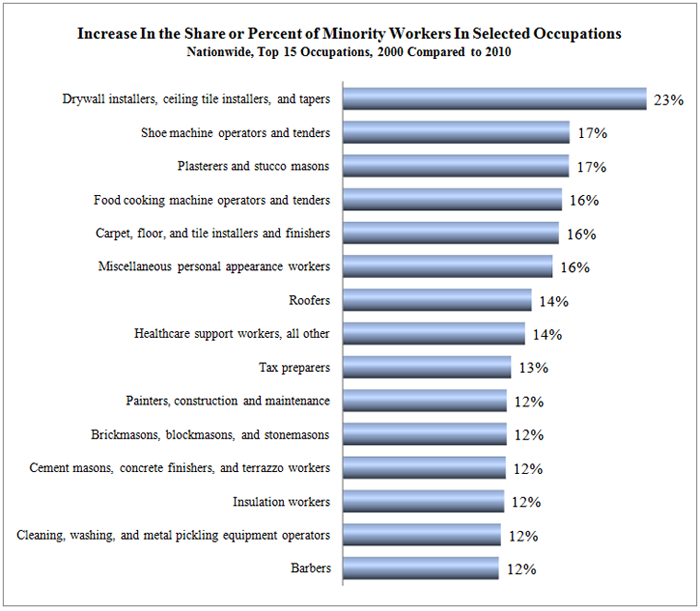
The comparison of the 2010 EEO and the 2000 EEO files also reveals substantial gains in the share of the minority workforce in some occupations. For example, nationwide, the percent minority in the "Drywall installers, ceiling tile installers and tapers" occupation was 38.0% in 2000, but the 2010 EEO file shows that the percent minority in this occupation has increased to 60.7%, or almost 23%. Similarly, the percent minority in the "Shoe machine operators and tenders" occupation was 29.6% in 2000, but the 2010 EEO file shows that the percent minority in this occupation has increased to 46.5%, or almost 17%. Finally, the percent minority in the "Plasterers and stucco masons" occupation was 52.3% in 2000, but the 2010 EEO file shows that the percent minority in this occupation has increased to 69.2%, or again almost 17%. The chart below illustrates the top 15 occupations with the largest increase in the share or percent of minority.
As the above simple comparisons show, the availabilities and the benchmarks based on 2010 EEO file may turn out to be different than what some contractors were using since 2005. We are continuing our review and evaluation of the new 2010 EEO file and I will report my findings in my future posts.
1. [See: OFCCP's Notice for Contractors on the 2006-2010 Census Tab here: http://www.dol.gov/ofccp/.] ↩
2. [Specific 2010 EEO Tabulations are available from United States Census Bureau's American FactFinder site at: http://factfinder2.census.gov/. The entire 2010 EEO Tabulation Files are also available at United States Census Bureau's FTP site at http://www2.census.gov/.] ↩